In this book, we discuss models for count data and continuous data with an excessive number of zeros.
For a detailed description, table of contents, R code and data sets, click on this link.
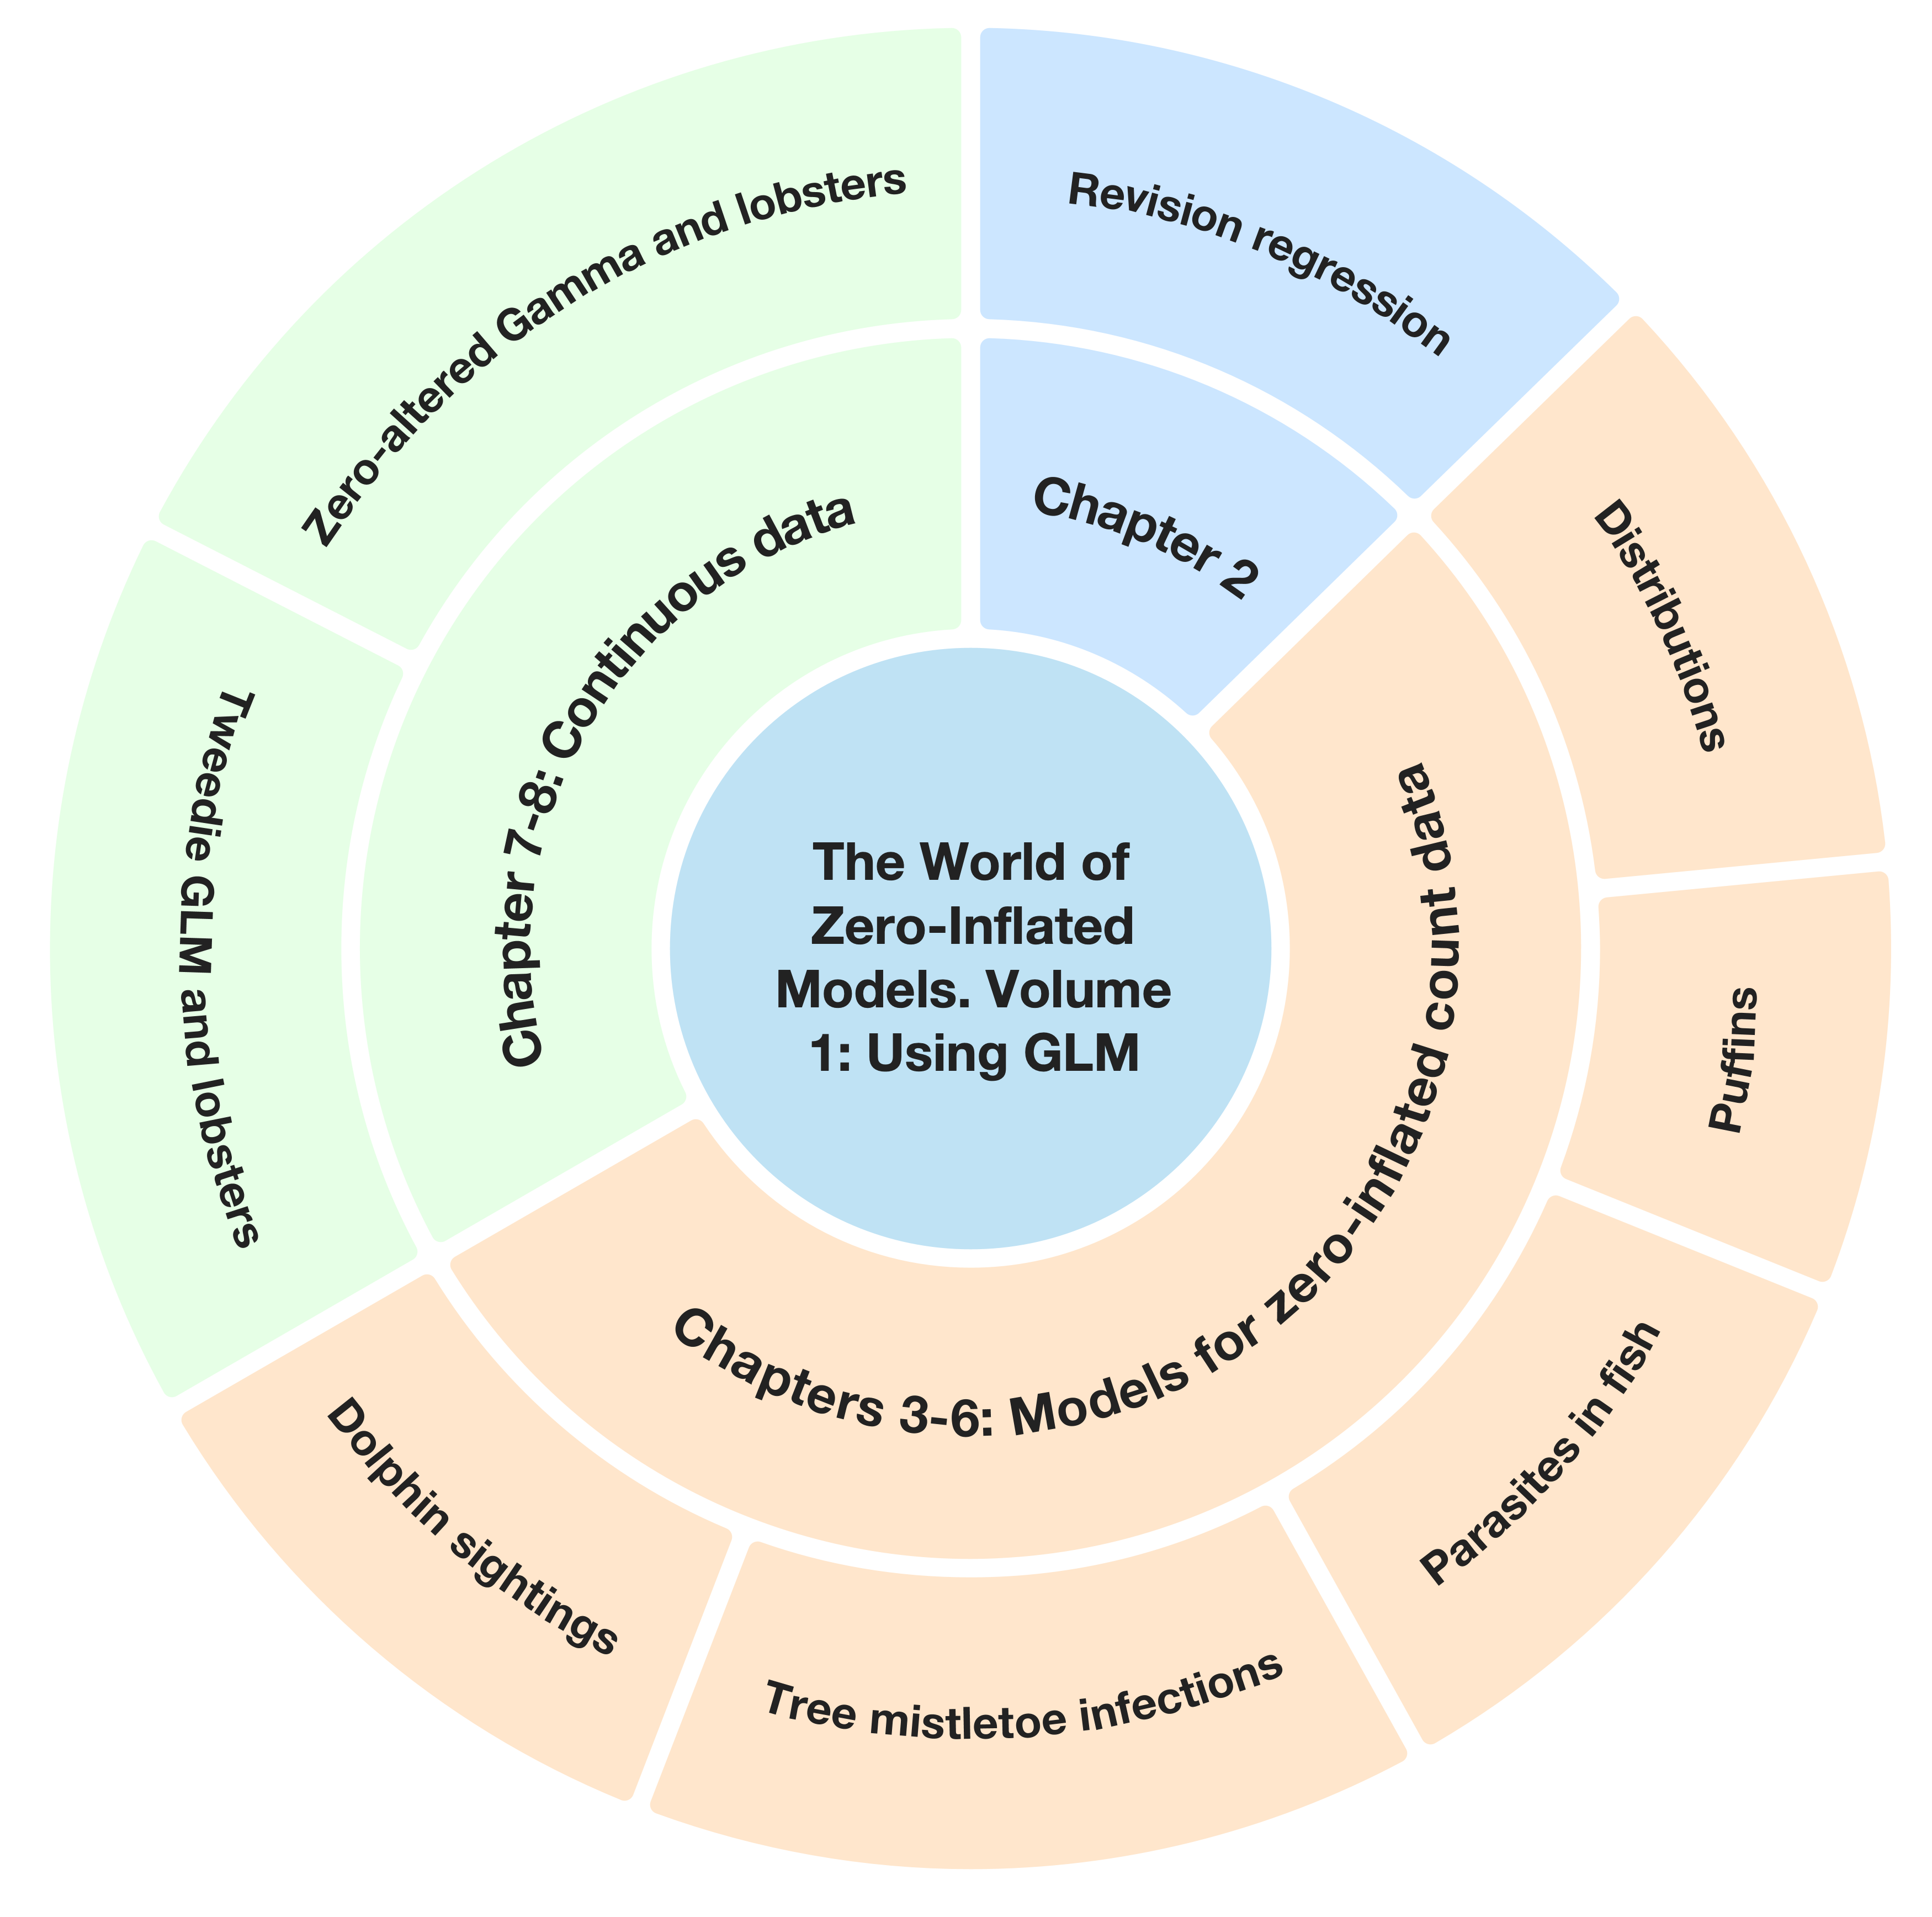
In Chapter 2 we revise data exploration and multiple linear regression using red knot data. Stable isotope ratios of nitrogen in animal tissues are modelled as a function of 3 covariates. This chapter serves as a blueprint for all other chapters in the sense that it shows the general outline of a statistical analysis.
Chapter 3 starts with a revision of the Poisson distribution and the Poisson GLM for the analysis of count data. We use a small puffin data set. We also introduce the NB GLM and two relatively unknown, but useful, members of the family, namely the GP GLM and the CMP GLM. Surprisingly, the latter two models tend to perform better than the NB GLM in the case of overdispersion. The latter two can also be used to deal with underdispersion. Most models are fitted with the glmmTMB package in R. Model validation tools are explained, and the concept of simulating data from a model (to verify whether it complies with all assumptions of the model) is introduced. We first do the simulation steps ourselves, then quickly migrate to the DHARMa package, which is rapidly gaining popularity.
In Chapter 4 we introduce zero-inflated models for count data, and these are executed with the glmmTMB package. We start with a basic introduction using simulated data, and discuss zero-inflated Poisson (ZIP), zero-inflated NB (ZINB), zero-inflated generalised Poisson (ZIGP) and zero-inflated CMP (ZICMP) models. We then apply them all on the puffin data set.
In Chapter 5 we analyse data on parasites in Brazilian sandperch. Such data nearly always bring you within zero-inflation territory. Now that we are familiar with Poisson, NB, GP, CMP models, and their zero-inflated cousins, it is time to learn how we can manoeuvre among them. How do we decide to apply an NB GLM or a ZIP model? In this chapter, we will keep the binary part of the model simple.
Chapter 6 is about ZIGP models. Data on mistletoe tree infections are used. The ZIGP models contain covariates in both the count and binary parts of the model.
Hurdle models for count data are discussed in Chapter 7 using dolphin sighting data. In a hurdle model we perform 2 analyses. First, the sighting abundances are converted into absence/presence data, and a Bernoulli GLM is applied. Then the zero counts are set to NA (or dropped), and a truncated Poisson (or NB) GLM is applied. In the third step, the two components are combined to calculate the expected values of the hurdle model. Chapter 7 is relatively long as it contains many topics that may be relevant: Bernoulli GLM, quasi-separation, truncated Poisson and NB distributions, and zero-altered Poisson (ZAP) and zero-altered NB (ZANB) models.
In the last two chapters of this volume, we discuss models for the analysis of continuous data with an excessive number of zeros. Biomass of lobsters are analysed using Tweedie GLMs in Chapter 8, and a ZAG model is applied on the same data in Chapter 9. The ZAG is a hurdle model for continuous data. Our recommendation is to opt for the Tweedie GLM approach.
The figure below shows a schematic outline of this volume.
")
